Metabase Dashboard for Outbound Campaigns
Metabase is used to analyze data in a much simpler way without using SQL. We maintain the following data for the companies:
- Number of ABC/OC/OS sent per day
- Orders placed via ABC
- Revenue generated via ABC
- ABC conversion %
How to create company-specific dashboards
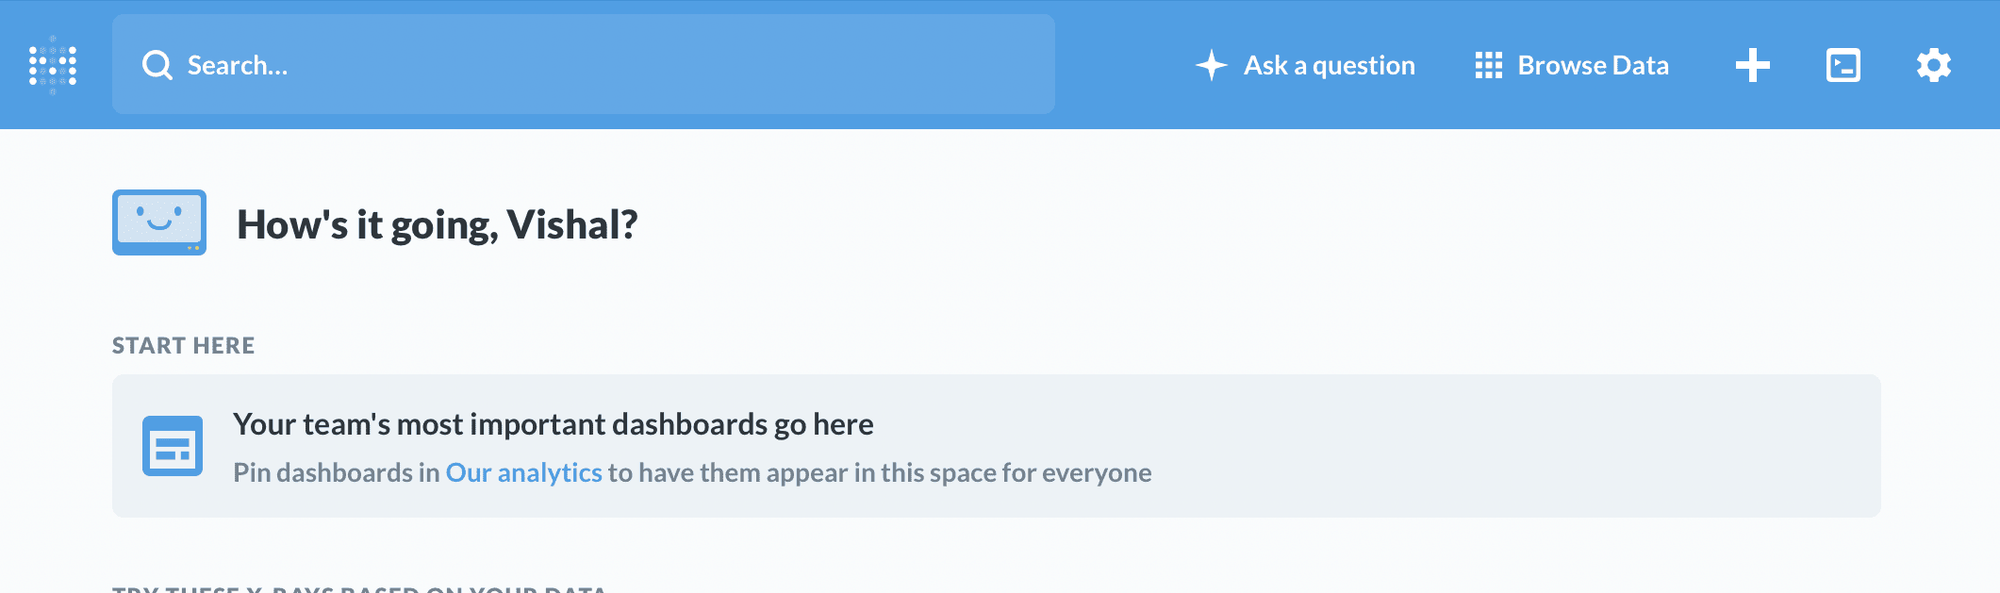
- Login into metabase.limechat.ai.
- Go to Browse all items under our analytics section.
- Click on New collection.
- Give a Name to the collection — Company_name Outbound Numbers.
- Select the + sign on top of the page and click on New dashboard.
- Name the dashboard — Company_name dashboard.
How to create Metabase dashboards for outbound campaigns
- Log into metabase.limechat.ai.
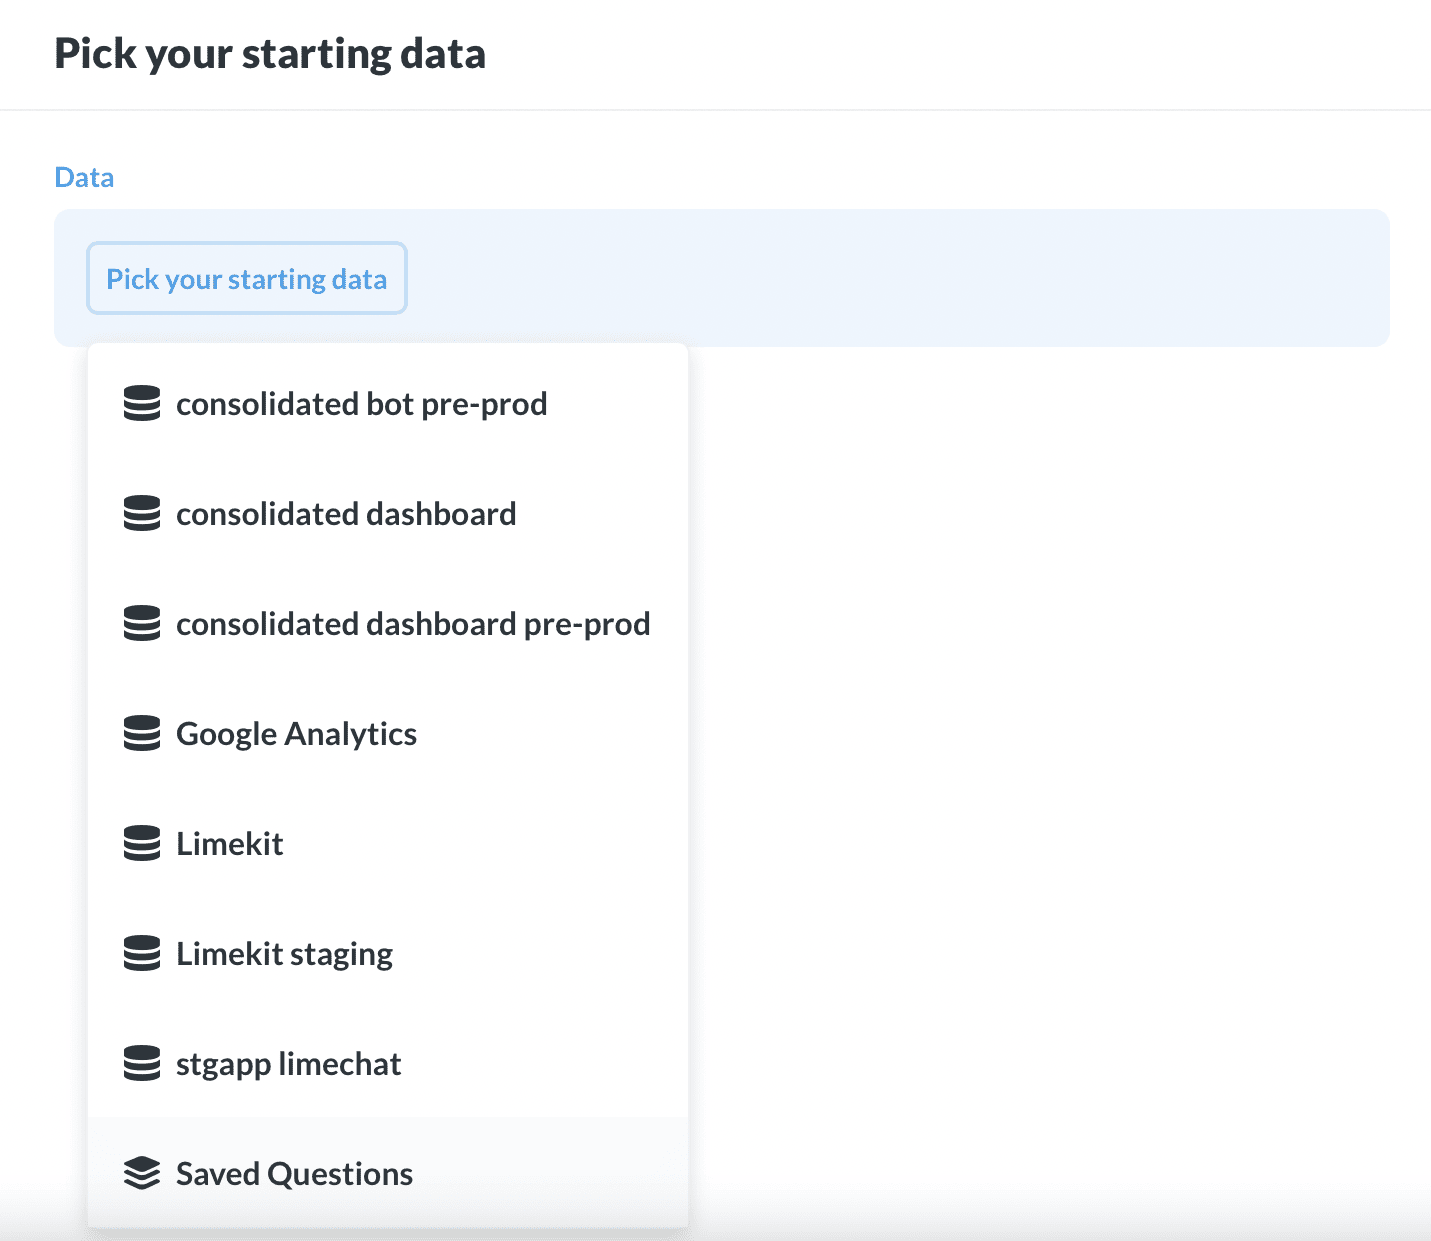
- Click on Limekit under Our Data tab.
Abandoned Checkout
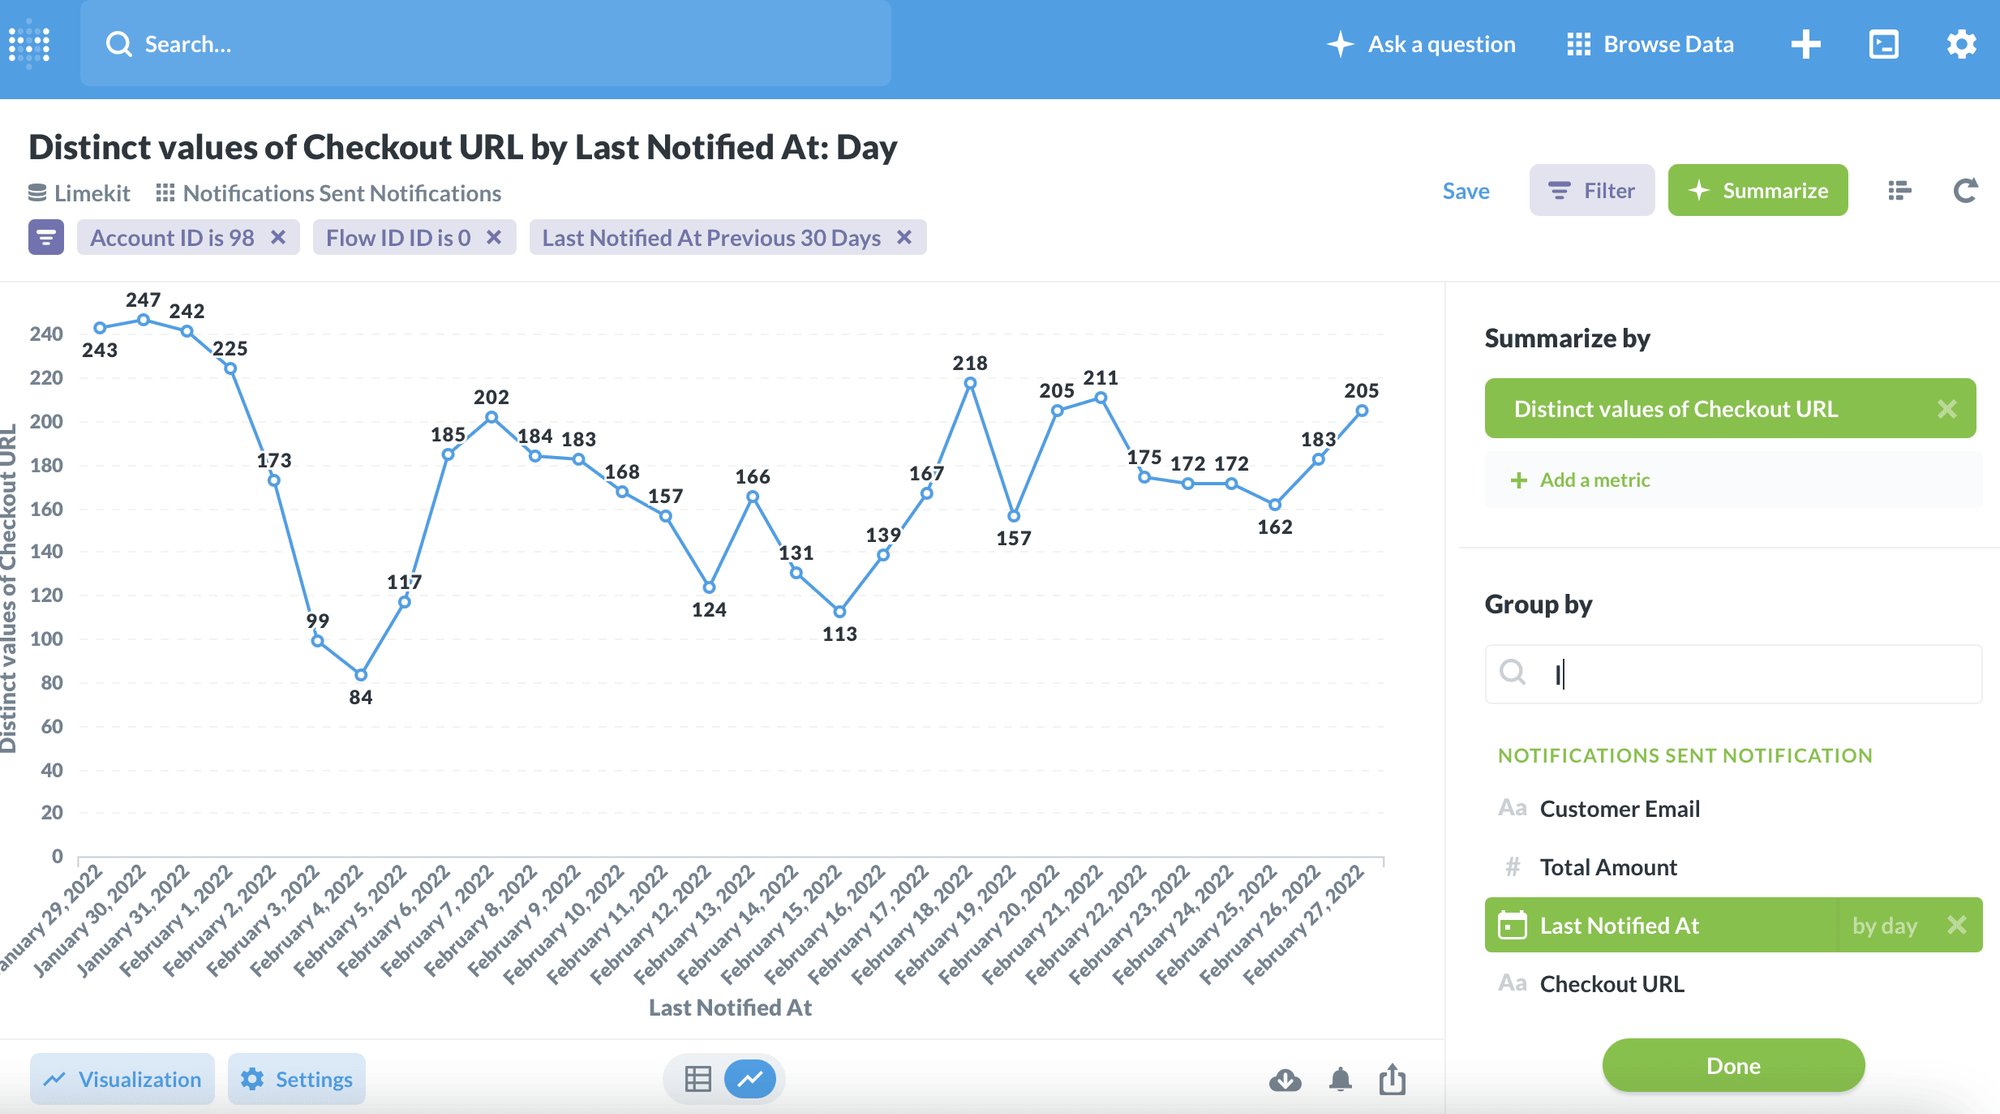
1. Number of ABC sent
Click on Notifications Sent Notifications.
Start adding different Filters
- Select the Account ID filter and enter the account id
- Select the Flow Id filter = 0.
- Select the Last Notified At filter and put the date range.
Go to Summarize option
- Summarize by Number of distinct value of checkout URL.
- Next, Group by last notified (make sure last notified is selected by day).
Go to the Visualization tab (bottom left of the page).
- Choose the Line visualization.
- Click on display and move the toggle of Show value on data points.
- Go to the axes tab and set the X-axis scale to ordinal using drop-down option.
Save the file with the relevant name.
Add it to company-specific dashboards
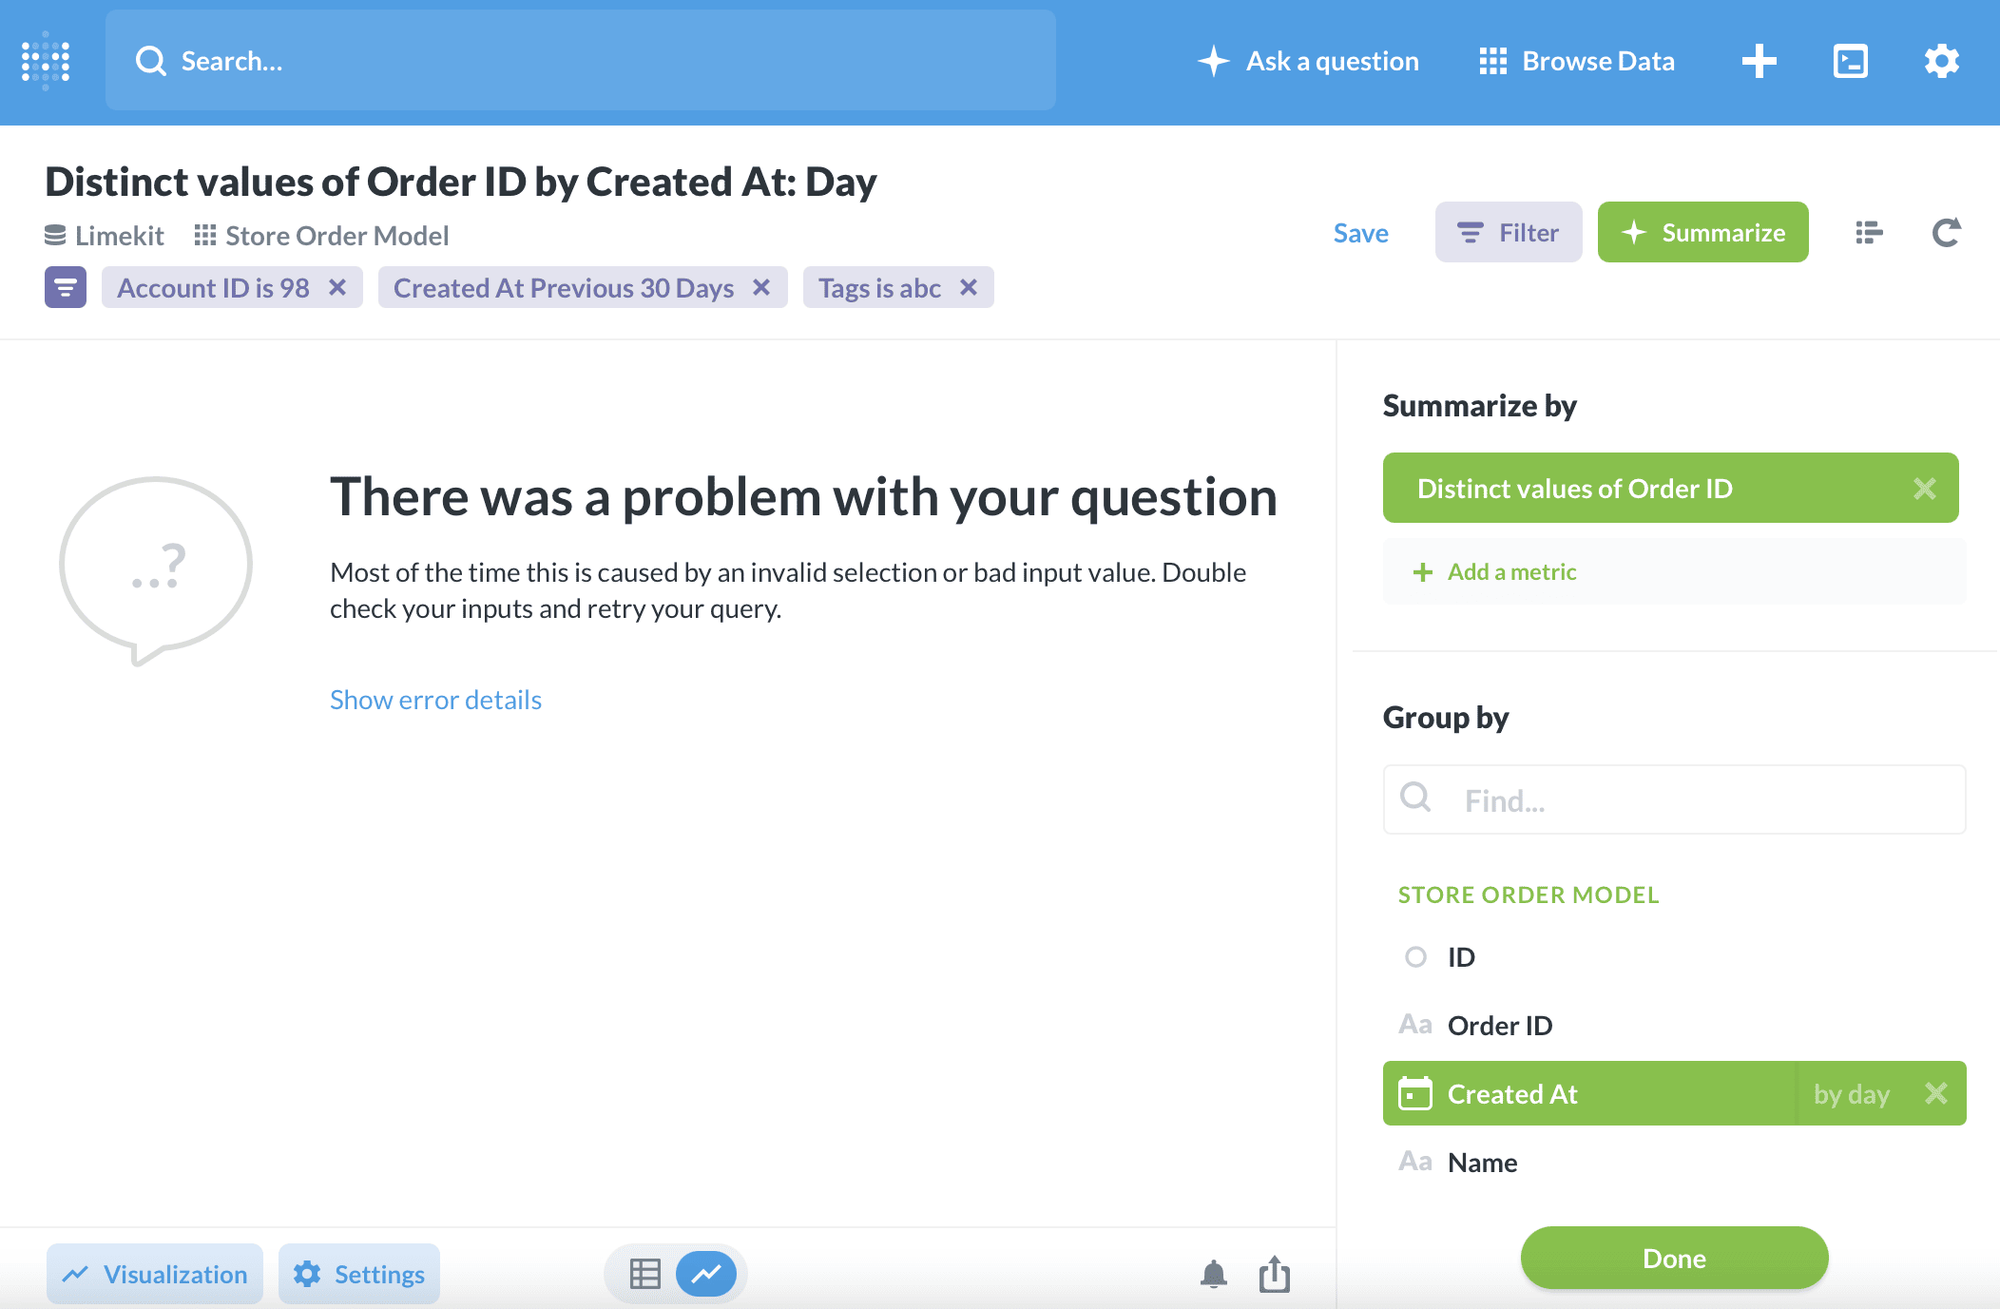
2. Orders placed via ABC
Click on Store order model.
Start adding different Filters.
- Select the Account id filter and enter the account id.
- Select the Created at filter and put the date range.
- Select the Tag filter = ABC (or anything).
Go to Summarize option.
- Summarize by Number of distinct value of order ID.
- Next, Group by created at (make sure last notified is selected by day).
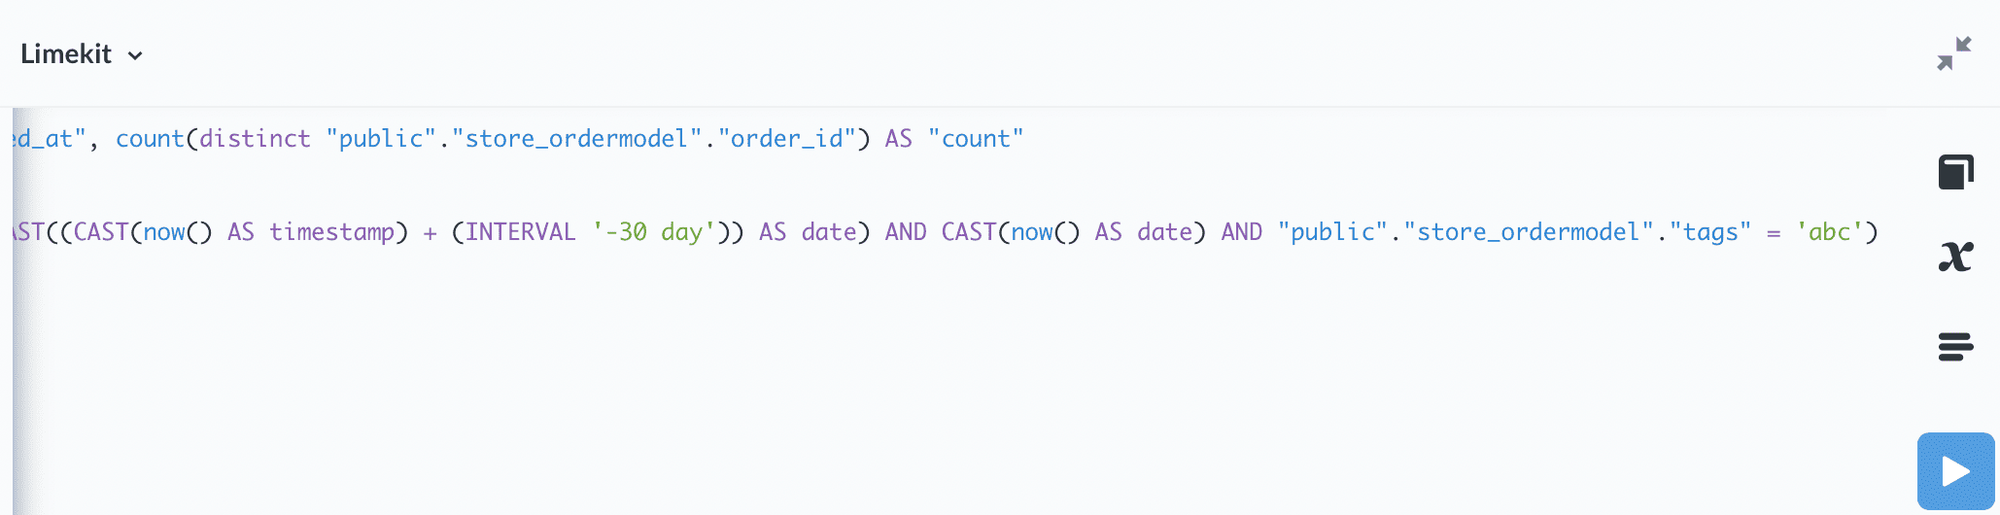
Click on Show editor (next to the Summarize tab).
Click on View the SQL (the last tab) and click on convert this question to SQL.
Remove - "public"."store_ordermodel"."tags" = 'abc') and add the following as per requirement:
- ABC conversion - "public"."store_ordermodel"."tags" @> (ARRAY['LC_ABC_ORDER'::character varying]))
- Reorder conversion - "public"."store_ordermodel"."tags" @> (ARRAY['LC_REORDER_ORDER'::character varying]))
- Upsell conversion - "public"."store_ordermodel"."tags" @> (ARRAY['LC_UPSELL_ORDER'::character varying]))
Go to the Visualization tab (bottom left of the page).
- Choose the Line visualization.
- Click on display and move the toggle of Show value on data points.
- Go to axes tab and set the X-axis scale to ordinal using drop-down option
Save the file with the relevant name.
Add it to company-specific dashboards.
3. Revenue generated through campaigns
- Repeat all the steps as same as above (order placed).
- Just make one change while summarizing
- Summarize by Sum of subtotal price.
4. ABC conversion
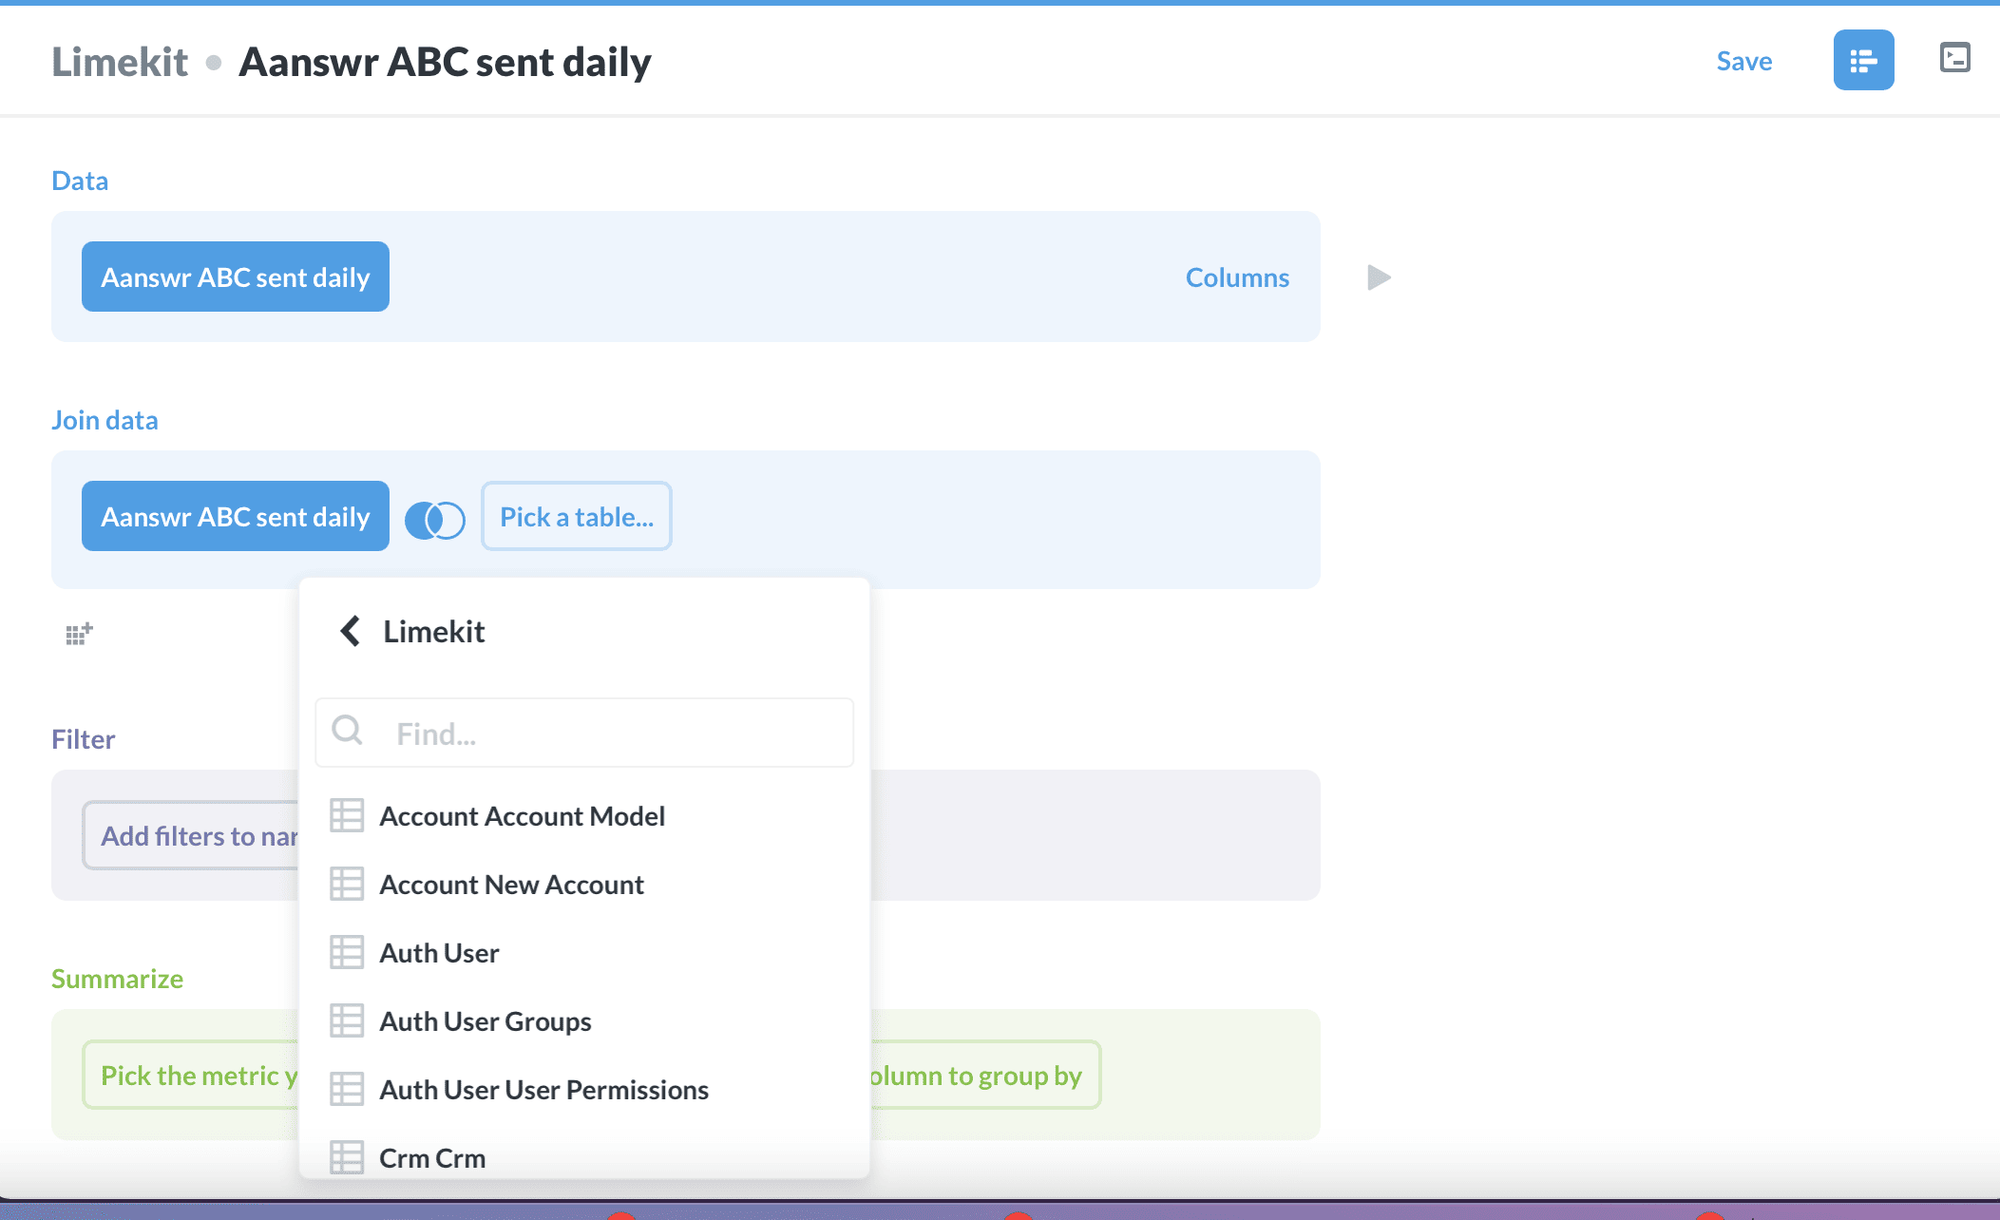
Go to Ask a question on top of the page.
Click on Custom question.
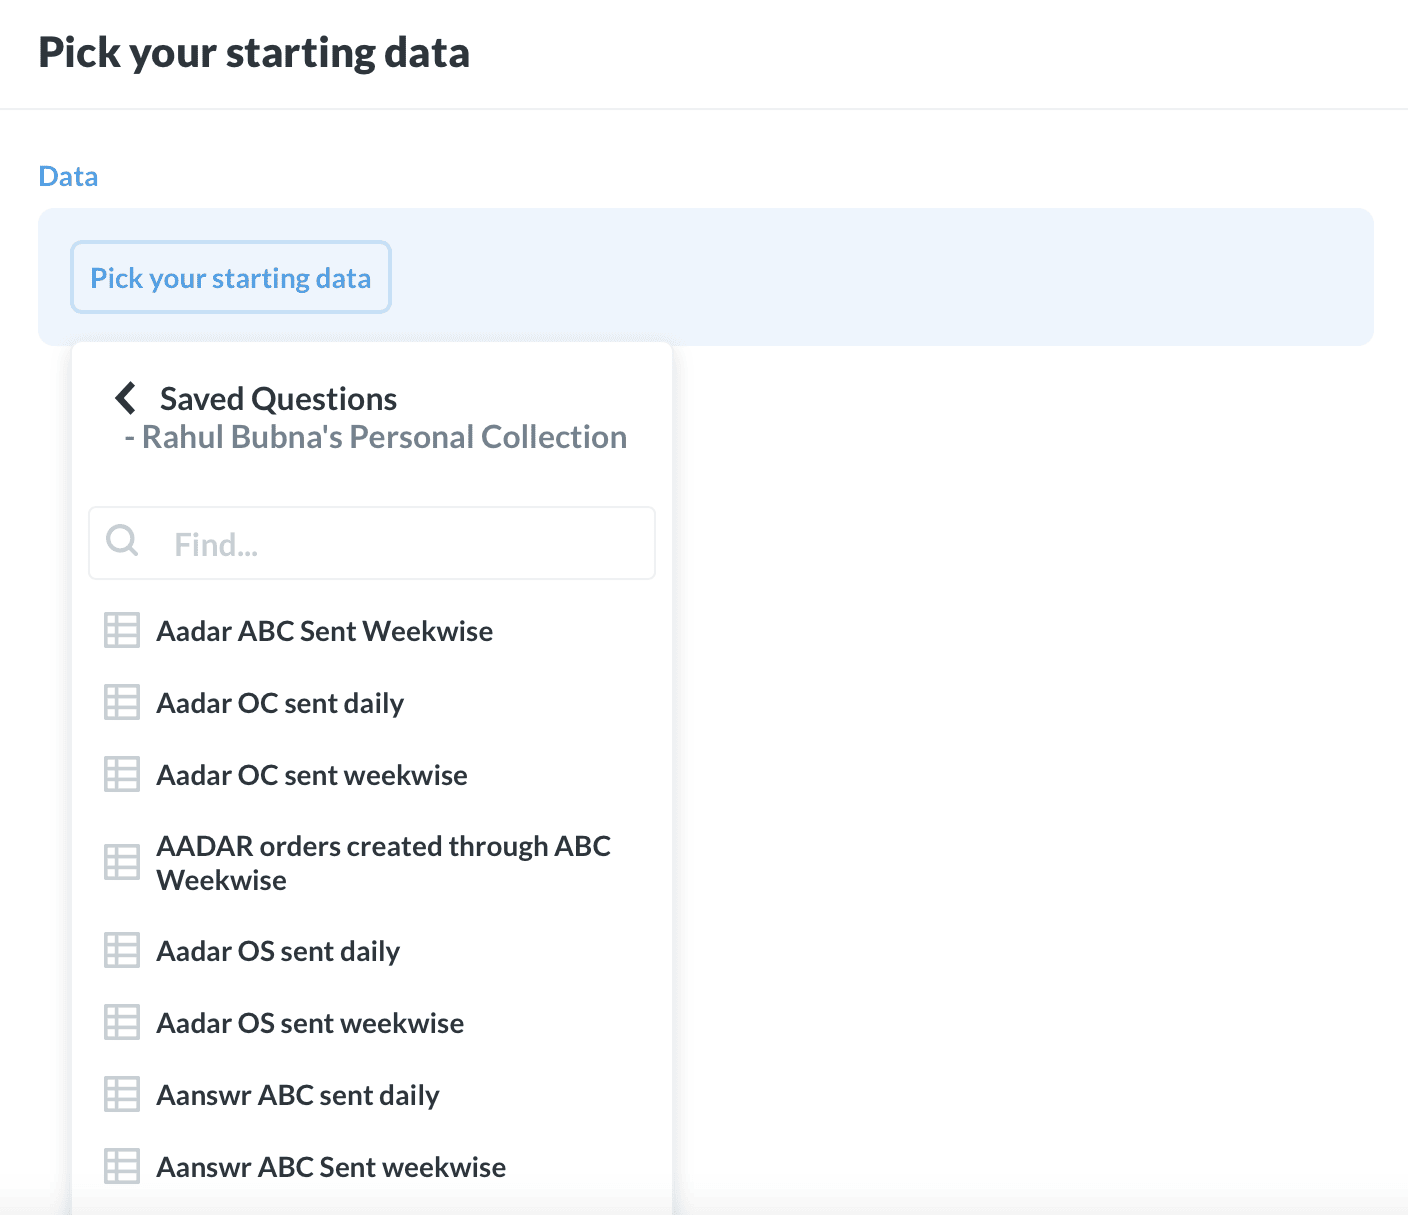
Go to Saved Questions.
Search the collection/dashboard where you have saved the Abandoned checkout sent graph.
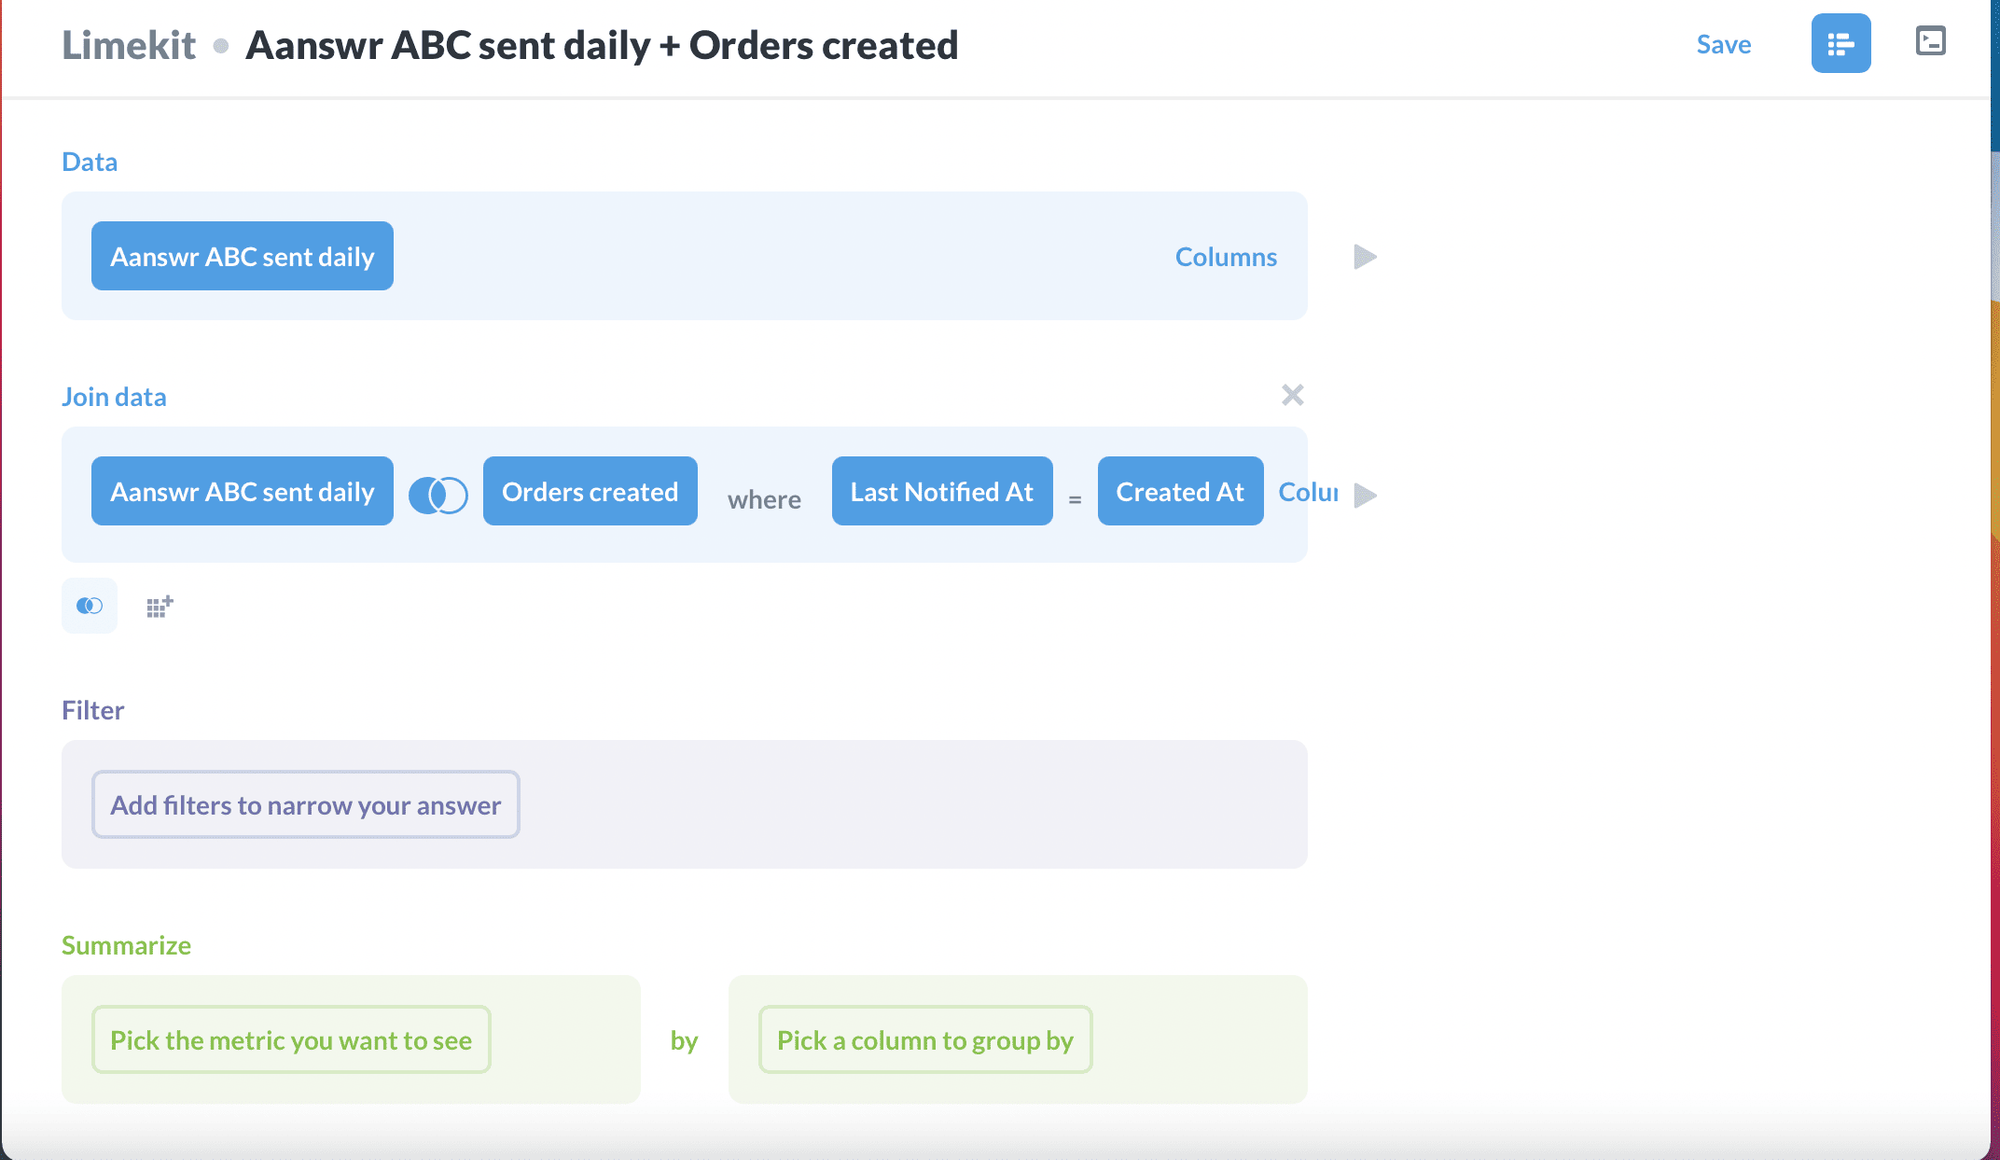
Next, we will join the Orders table.
-d570e98b6e13fdddc6316db569fcb633.png)
Click on the back icon. Go to saved questions. Search for the collection and select the orders graph.
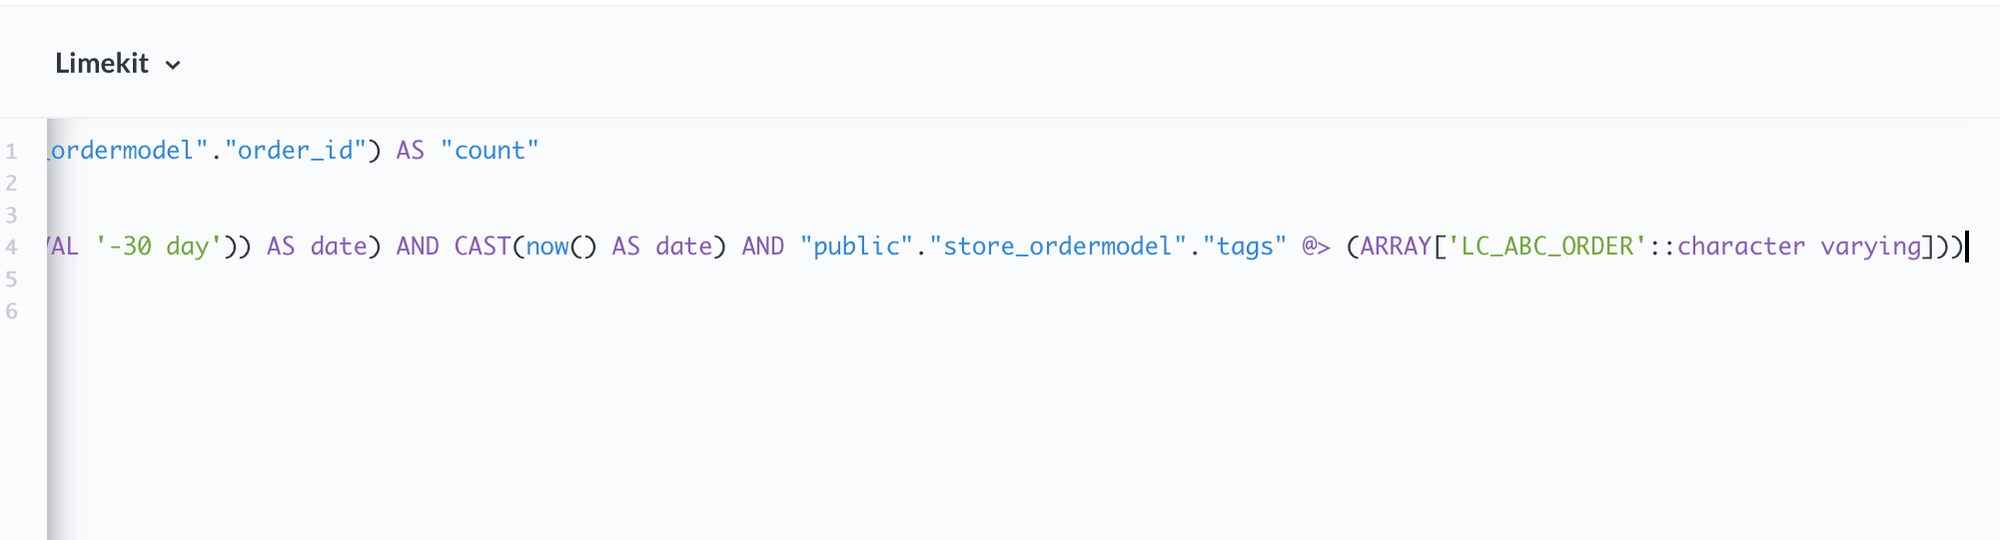
Click on View the SQL and click on Convert this question to SQL.
Now we need to modify the query in the 1st line after “count_2”.
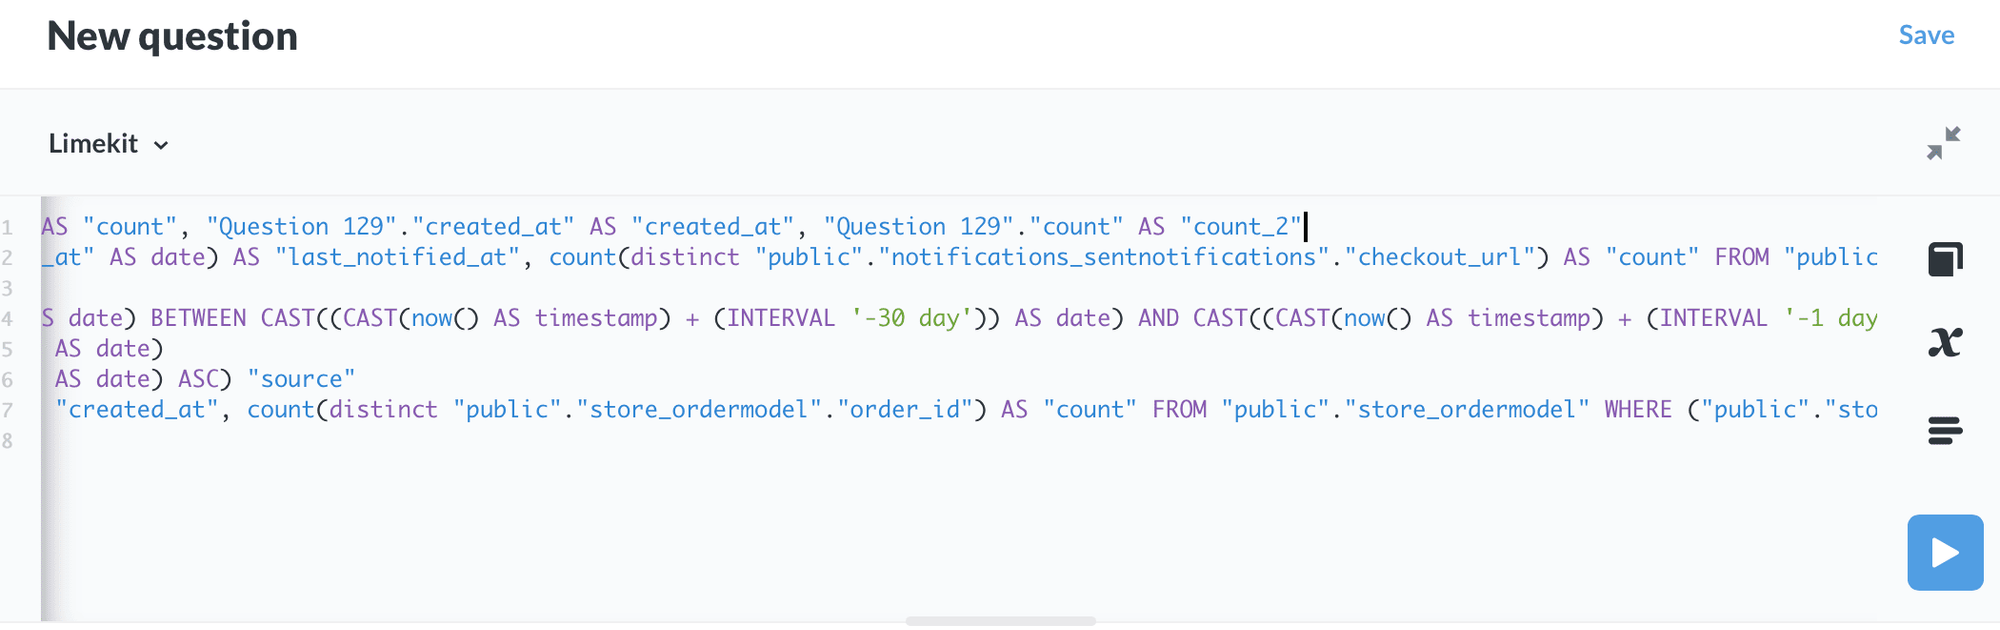
Add the line as mentioned in the below pic.
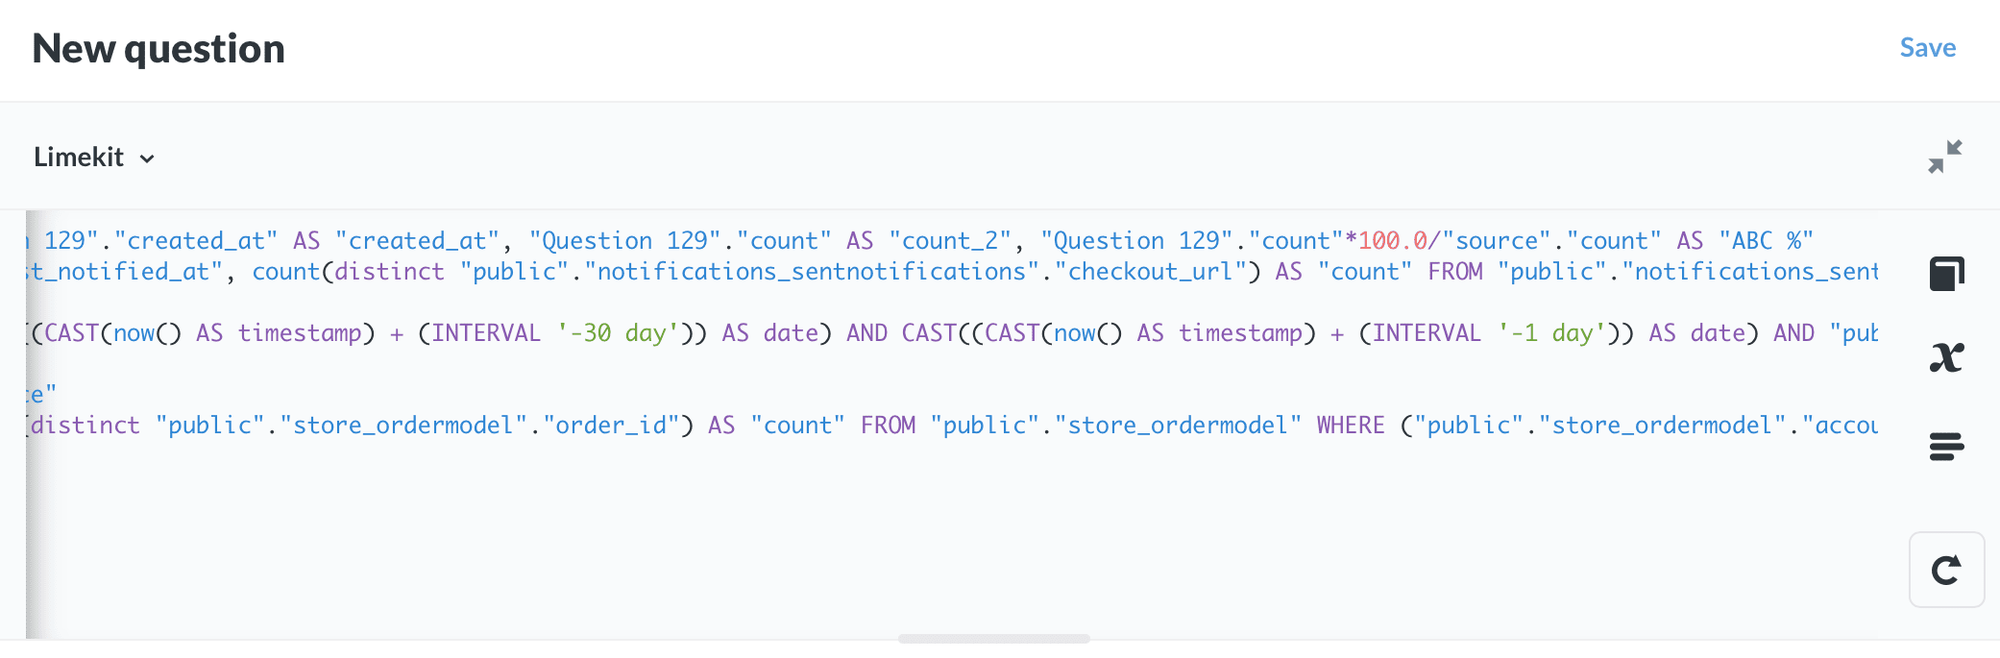
Run the query and save the file with the relevant name.
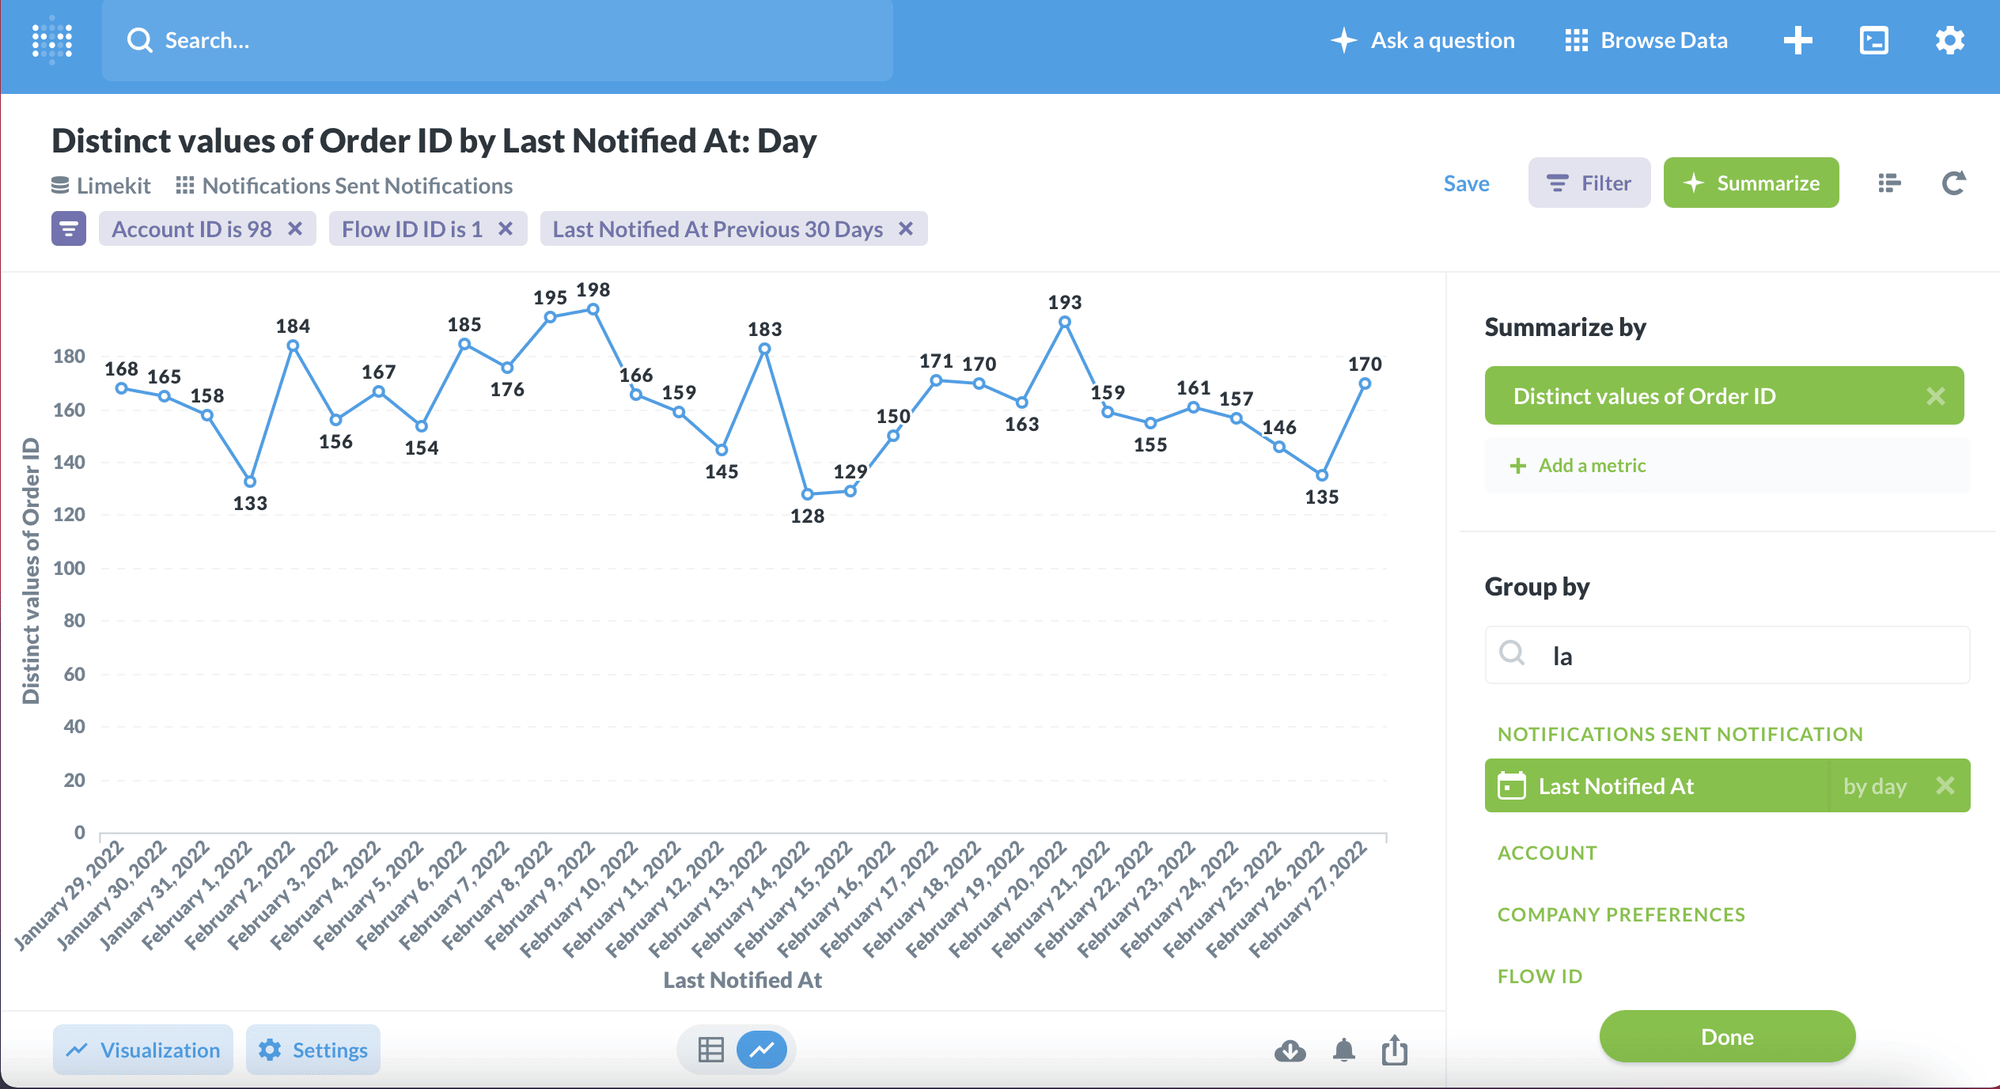
Number of OC/OS sent
Click on Notifications Sent Notifications.
Start adding different Filters.
- Select the Account Id filter and enter the account id.
- Select the Flow id filter = 1 (OC) / 2 (OS).
- Select the Last notified filter and put the date range.
Go to summarize option.
- Summarize by Number of distinct value of order ID.
- Next, GROUP BY last notified (make sure last notified is selected by day).
Go to the Visualization tab (bottom left of the page).
- Choose the Line visualization.
- Click on display and move the toggle of Show value on data points.
- Go to axes tab and set the X-axis scale to ordinal using drop-down option.
Save the file with the relevant name.